
Are you drowning in data? Suffering from a touch of data overwhelm? Power BI can help! 📊📈
- Jill Singleton

- Apr 29, 2022
- 6 min read
Updated: Dec 9, 2023

Welcome to the Iamdata Solutions Asset Management Monthly Newsletter - May 2022
All organisations collect so much data nowadays. We know that data is invaluable if we are to make well informed, evidence-based decisions about the management of our infrastructure assets. But, just knowing that we have terabytes of asset data isn't enough. We have to access it, bring it together in the one spot, and then perform analysis on it before we can get any meaningful information out of it. Have you ever felt this data overwhelm in your work? Sometimes it seems an almost impossible task to organise the data to provide us with the insights we need.
There is a very famous ‘jam experiment’ that presented shoppers with a display of 24 varieties of gourmet jam. On another day, the researchers displayed only 6 varieties of the jam. While the larger display attracted more interest, people who saw the smaller display were ten times more likely to buy than the people who saw the larger one.
I completely get this! On one of the very rare occasions when I just want to relax in front of the TV, I waste the time I could have spent watching something flicking through hundreds of Netflix movies never settling on anything. There are just too many choices! It is a fact that when we are faced with too many choices, we choose not to choose at all. If we are experiencing similar data overload in our work, this is not only frustrating but may result in the data not being utilised at all because it's just too hard.
But, help is at hand!
A relatively easy way to bring together disparate datasets utilising Power BI
If you're analysing bad data, you won't be able to trust your results. That's why taking steps to ensure your data quality is of a high standard is crucial.
I have helped many councils cleanse, transform, consolidate, and visualise their corporate data without the need for them to spend hours of their valuable time drowning in spreadsheets.
My favourite tool for bringing order to the chaos is Power BI. Their quote sums it up well, ‘Find clarity when you need it most’ (I should point out that I am in no way affiliated with Microsoft or Power BI, and I’m not getting paid to sing its praises).
The Big Picture
One of the main reasons for data overwhelm is that often we try to collect and analyse too much information. It’s ok to keep all the information that you may need secure in the database, but we only need a few key pieces of information to analyse to get some great insights into what our data is telling us. We need to look at the big picture and determine what the intended use is for the data. What are our expectations? What are the goals?
Data Locations
Once we have determined what key information is required, we need to understand where the data is located – (in which systems / folders / format?)
Power BI's Strength
One of Power BI's strengths is that it can connect to many different data sources. The list seems to grow each time I click the 'Get Data' button. More connections are being added daily!
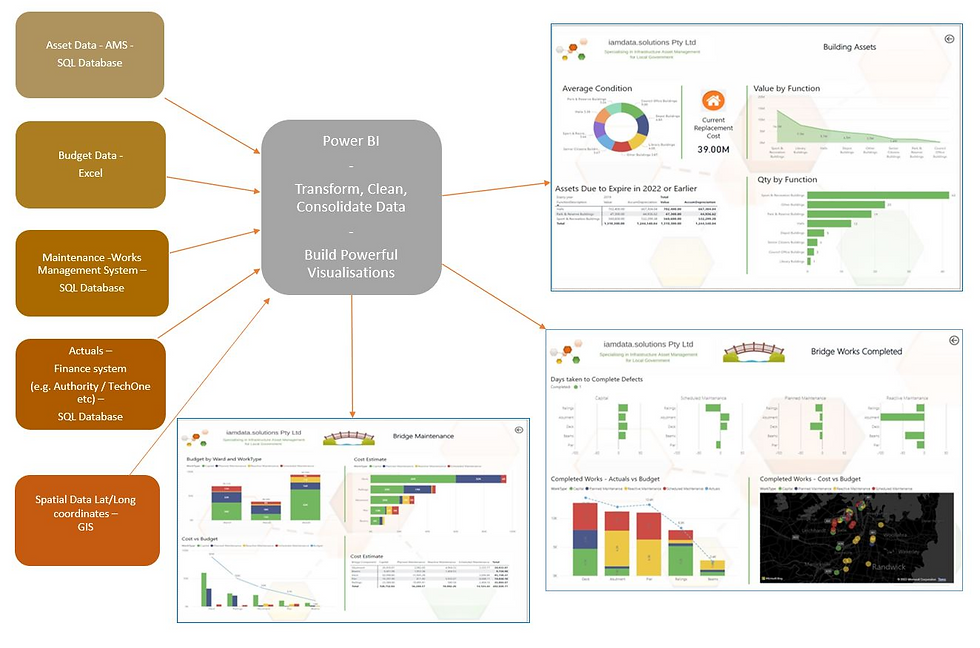
The illustration below is a good example of how I’ve been able to access data from different sources and bring it into the Power BI data model to create these visuals.
In these examples, I’ve built the visuals utilising data from:
The Financial system (Actuals) (SQL database)
Works Management System (Bridge Defects and Work Type) (SQL database)
Power Budget (Budget data) (Excel)
GIS (Location Information Lat/Long) (SQL database)
Clean, Transform and Consolidate data on import
Typically, data is entered into the various corporate systems within an organisation by the data owners who are the experts in that field. For example, a Rates Officer enters Property & Rating data into the Property system, Accountants enter financial data into the Finance system, and Asset Managers enter data about their assets into the Asset Management system, etc.
While all these systems have many built in checks to allow data formatted a specific way to be entered into the system while rejecting it if it is incorrectly formatted, it is still difficult to stop incomplete or inaccurate data being entered into the systems. Power BI can help us identify these errors in the data.
The very first step for building a Power BI Report is to connect with the various data sources and query out the data into your Power BI Report.
Connecting to the data source
In most cases, I recommend the Import option. This is the best option for many reasons, including:
It is the fastest to load because it can leverage the power of the Power BI engine.
You can have multiple data sources as there are no restrictions. This is exactly what we need if we are going to build a model similar to the example above.
No restrictions on data transformations, or data modelling. This is important to note because you will need transformation and modelling capabilities when modelling asset data in Power BI.
Imported data can be refreshed every 30 minutes or 8 times a day if needs be, but a nightly refresh would probably be sufficient for most infrastructure asset data. You can always manually refresh a table or the entire Power BI data model if required. A full refresh can take up a lot of computing power and are machine resource intensive. The refresh process could be quite cumbersome if the datasets are large or have lots of dependencies.
If you intend to apply row level security, then it's worth noting that row level security unlimited.
Connect to the data and the Query Editor Interface
Shape, Transform, and Load Data

Once you connect to data, the Query Editor lets you shape & transform the data to meet your needs, then load that model into Power BI Desktop.
Here is a quick whirlwind Power BI video where we can take a quick look at how we can use the Power BI Query Editor to help us validate and cleanse the data we want to bring into the Power BI data model.
Building Visuals that will help to identify where the data is incorrect
We have looked at how we can find issues with the data we have connected with even before building any visualisations in the Power BI. Now we’ll look at some ways we can use Power BI to find specific errors in the data.

This visualisation looks at the Sewer Nodes. In this example, I’ve built queries to identify where incorrect data has been entered into the database that Power BI is drawing the data from.
For example, the queries are performing these calculations:
Where the Cover Level is equal to 0 then the query performs a calculation to minus the Lidar Elevation from the Sewer Pipe End Invert Level and provides the answer in column CalculatedDepth
If the Cover Level is greater than 0 then the Sewer End Invert Level is subtracted from the Node Cover Level and provides the answer in column CalculatedDepth
Where the Sewer Node Cover Level is 0 then the query performs a calculation that subtracts Sewer End Invert Level from Sewer Node Lidar Elevation and subtracts the Sewer Node depth from that, which populates the column CalcDifference
Power BI can easily identify errors or anomalies in the data, and the results can then be provided to the data owner within the organisation to amend the data accordingly at the source.
Here is another example where Power BI can identify where data is missing or incorrect.

Or it could be as simple as this:

I hope you have found this newsletter interesting and useful. Keep a look out for more Power BI to come in the following newsletters.

I have worked on many different projects with my Local Government clients, from designing and developing Power BI Reports, to building SQL Server databases for spatial data, to managing and maintaining the GIS and the Asset Management systems. If you'd like to discuss how we might work together, then please email me at ➡️ jill.singleton@iamdata.solutions
If you would like to receive the latest Newsletter Blog straight to your inbox, please subscribe here: ➡️ https://www.iamdata.solutions/subscribe
You can read all our Newsletters and Blogs here:➡️ https://www.iamdata.solutions/blog
You may also be interested in our Projects Page:➡️ https://www.iamdata.solutions/past-projects
Check out what our clients say about us here:➡️ https://www.iamdata.solutions/reviews
If you would like to see a particular topic covered in these newsletters, then please let me know about it. The chances are other people will be interested and would like to hear about it too! Please email me at: ➡️ jill.singleton@iamdata.solutions with your suggestions.


Kommentare